

Patrick Meenan (@patmeenan) created WebPagetest while working at AOL and now works at Google with the team that is working to make the web faster.
When working on web performance we often spend a lot of our time staring at resource waterfalls to identify issues with sites. There is a lot you can tell without having to look to closely and most of the key issues with a page will be identifiable from even just looking at the thumbnail view of the waterfall. Here is a collection of things to look out for and what they look like (taken from actual tests of real sites run on WebPagetest).
Poor Caching
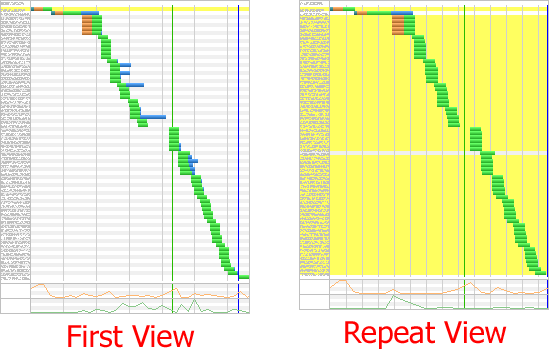
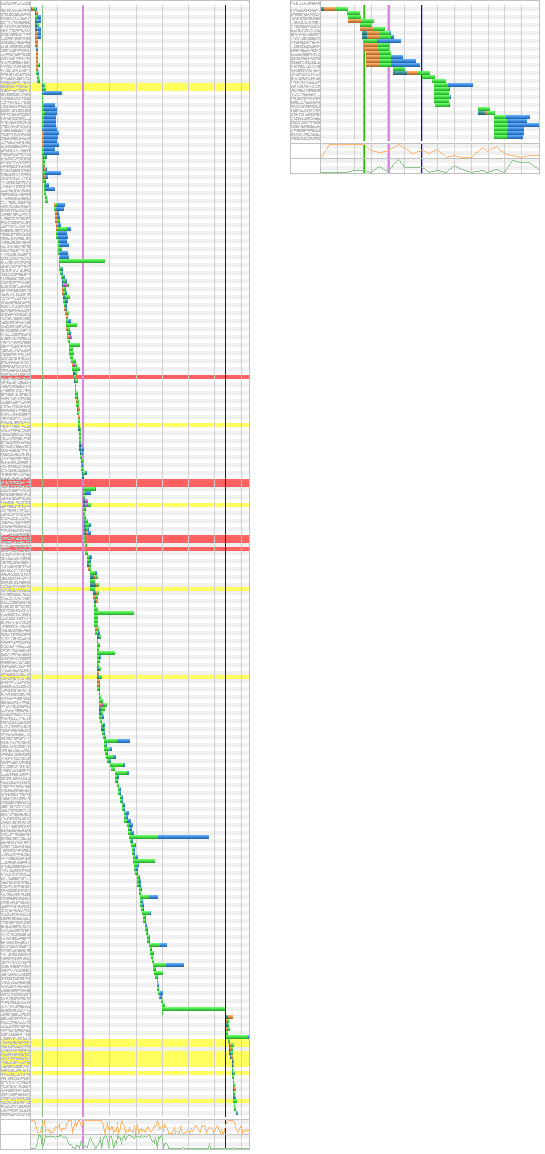
If the repeat view contains a lot of yellow-highlighted requests and is similar in size to the first view then it is quite likely that most of the resources on the page do not have a proper caching header and the browser is re-validating all of them instead of serving the resources from the local cache
Slow Back-End

The first request in the waterfall (assuming no redirects) is for the base page and is usually the only request in a waterfall that talks to the application server code (triggering database queries and all of the application-specific logic). The light green part of the bar is the amount of time from when the browser sent the request until the server response started to come in. Optimally this would be the same size as the orange bar that immediately precedes it which is the time to establish the connection to the server (and a good proxy for the round trip time). If the green bar is noticeably longer than the orange bar then there is a back-end problem that should be looked at. This shows up a lot in cases where the site is hosted on shared hosting, particularly for sites that require talking to a database.
Base Page Redirect
Yellow-highlighted rows in the waterfall indicate server HTTP responses in the 300 range. This includes both redirects as well as 304 (not modified) responses. When you see a yellow row for the first request in the first view of a test it means that the server sent a redirect. It’s common to see redirects that go from a bare domain to the www. version of a domain, redirects for mobile versions and redirects for language or country-specific versions of sites. The redirects themselves are not necessarily bad but if you see a redirect you should make sure that it is a 301 (permanent) or if it is a 302 redirect that it has caching headers.
Slow Base Page Redirect

If the server is issuing a redirect you want that response to be lightning fast (no longer than the orange bar). When you see a slow redirect for the base page (long green bar) it usually means that the redirect is being triggered by the application logic. Optimally you would configure the redirects to be issued by the web server itself (in the case of Apache, through rules in .htaccess or in the server config).
The redirect time is 100% wasted so you want to get it out of the way as soon as possible if you can’t eliminate it.
Resource Errors
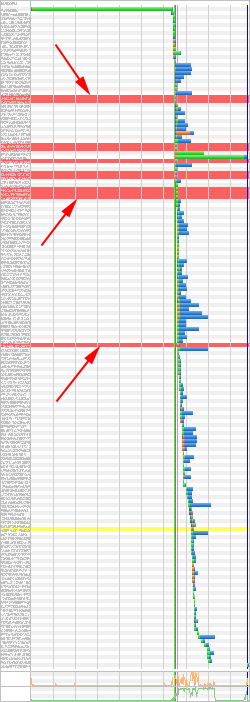
Red-highlighted rows in the waterfall indicate server HTTP responses in the 400+ range with 404 (not found) responses being the most common. If you see any red rows in the waterfall then something that was supposed to load for the page didn’t and it’s worth looking into and fixing.
Disabled Keep-Alive
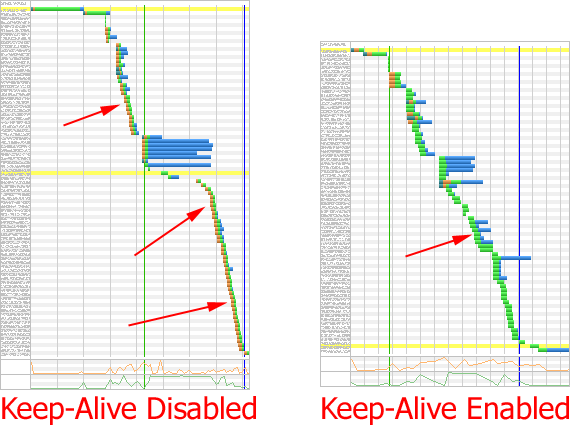
If you see orange bars at the beginning of most of the resource requests then that usually indicates a problem with the server configuration where keep-alives are disabled.
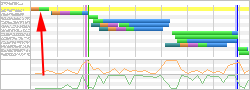
Slow, Blocking Resource
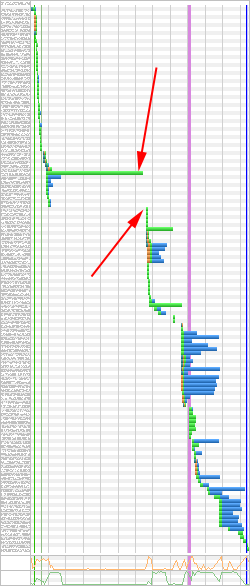
If you see a long bar in the waterfall without many other requests happening at the same time and then a bunch of requests appear to start after it finishes loading you are looking at a blocking resource dependency. You need to make sure that resource loads as quickly as possible but it’s also worthwhile to see if you can eliminate it’s blocking behavior and figure out why the rest of the resources do not load until it completes.
Large Resources
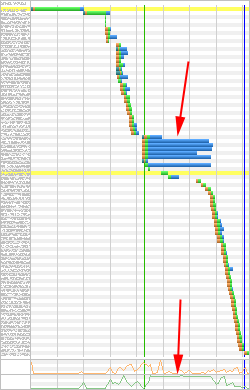
The blue part of the bar for resources in the waterfall is where the content is actually being downloaded. When you see large blue bars it usually indicates really large resources that are being downloaded (particularly if the green bandwidth graph at the bottom of the waterfall is pegged). Reducing the size of those resources through better compression (for images) or gzip (for text resources) will usually yield significant improvements to the user experience.
Bandwidth Constrained
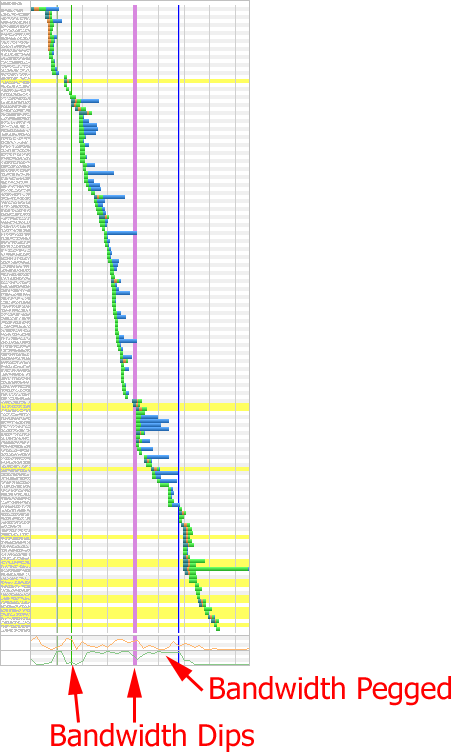
When the bandwidth graph at the bottom of the waterfall is pegged, the only way to deliver that content faster is to make it smaller (or eliminate/defer some of it) or make the experience better by playing with the order that the resources load in. Any place there are dips in the bandwidth are opportunities for improvement, usually around blocking script or script execution.
Slow DOM Content Loaded Execution
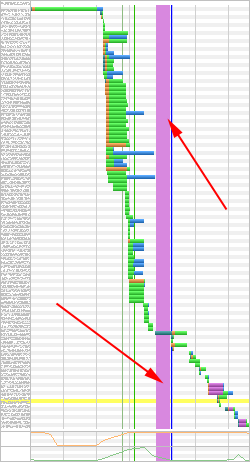
The vertical pink bar in a waterfall is the amount of time it took the browser to execute script attached to the DOMContentLoaded event (which includes JQuery $(document).ready() code). It is only reported for browsers that support Navigation Timing but that is most of the major browsers these days (Safari being the notable exception). Optimally the vertical bar will be really thin and a single vertical line. If it looks more like a column then it’s worth looking at the code that is executing to see if it can be optimized. Using Chrome and enabling timeline capture should point out the code that is being executed and make it pretty easy to drill into.
Lots of Requests
Just from the vertical size of a waterfall you can start to get a sense for if there are a lot of requests or not. In the extreme case, when the waterfall thumbnail no longer fits on the screen then it’s worth looking into.
Slow to Paint Initial Content
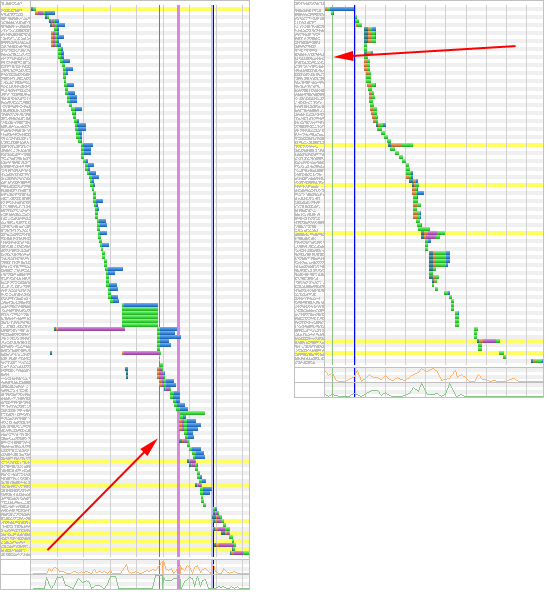
The vertical green line in the waterfall is the point where the browser displays the first non-white part of a page to the user. You want that to be as far to the left as possible and optimally without having to wait for any external resources. It’s worth validating in the screen shots that the page is displaying something useful but anything is a better progress indicator than nothing. If you see it being drawn after several requests then there is likely a lot of blocking css and js at the top of the document and that should be fixed.
Other Common Patterns
These are the patterns that I usually see when looking at waterfalls but they are just the tip of the iceberg. You can start to recognize more patterns the more you look (multiple base page redirects, SSL negotiation times, etc) and the more you get used to looking at waterfalls the better you will get at recognizing areas to investigate for performance improvement opportunities.